
Site analytics totals for: May 1, 2021 – May 31, 2021
Audience Overview:
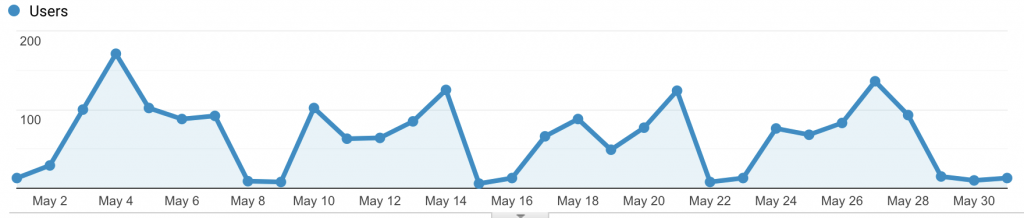
-
-
- Visitors: 1,423
- Sessions: 2,466
- Number of Sessions/User: 1.73
- Pageviews: 9,409
- Pages/Session: 3.82
- Avg Session Duration: 4:55
- Bounce Rate: 39.05%
-
Location:
United States
-
-
-
- U.S. based visitors – 1,369 (96%)
- New York State visitors – 1,047 (76%)
- Other notable states – TX, IA, WY, CA, WA
-
-
New York Regions
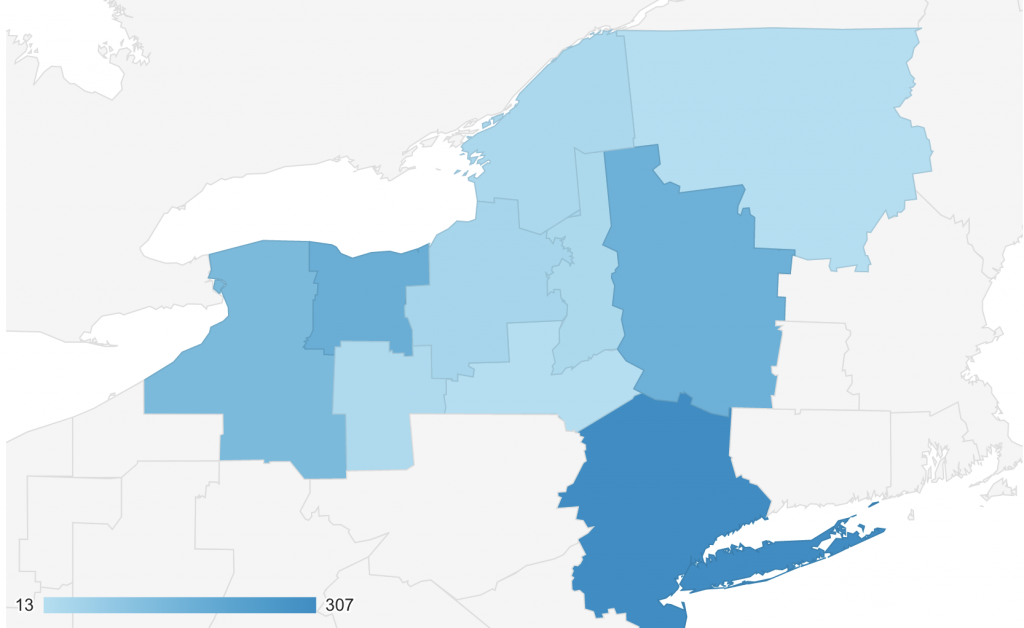
-
-
-
- NYC/LI – 307 (29%)
- Rochester – 181 (17%)
- Capital Region – 170 (16%)
- Buffalo – 137 (13%)
- Unknown – 109(10%)
- Syracuse – 45 (4%)
- Watertown – 35 (3.25%)
- Utica – 32 (3%)
- Elmira – 28 (2.5%)
- Plattsburgh – 14 (1%)
-
-
Desktop vs. Mobile:
-
- Desktop – 92%
- Mobile – 7.8%
- Tablet – <1%
Browsers:
-
- Chrome – 79%
- MS Edge – 9%
- Safari – 9%
- Firefox – 2.25%
- Internet Explorer – <1%
Traffic:
-
- Direct – 59%
- Search – 27.5%
- Referral – 11%
Landing Pages:
-
- Home – 1,613 pageviews (17%)
- Culturally Responsive Education – 796 pageviews (8.5%)
- SEL – 445 pageviews (4.75%)
- PD Calendar News – Asynchronous Trainings – 412 pageviews (4%)
- Students with Disabilities – 376 pageviews (4%)
- PD Calendar News – 357 pageviews (3.79%)
- ELLS and/or MLS – 338 pageviews (3.59%)
- Families as Partners – 281 pageviews (3%)d
- Module 3 High Expectations and Rigorous Instruction – 277 pageviews (2.9%)
- Welcoming and Affirming Learning Environments – 227 pageviews (2.4%)