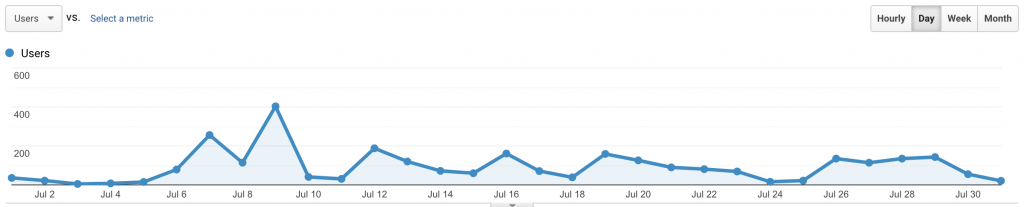
Site analytics totals for: July 1, 2021 – July 31, 2021
Audience Overview:
-
-
- Visitors: 2,391
- Sessions: 3,342
- Number of Sessions/User: 1.40
- Pageviews: 9,912
- Pages/Session: 2.97
- Avg Session Duration: 3:30
- Bounce Rate: 41.41%
-
Location:
United States
-
-
-
- U.S. based visitors – 2,349 (98%)
- New York State visitors – 1,397 (59%)
- Other notable states – TX, IA, WY, VA, WA
-
-
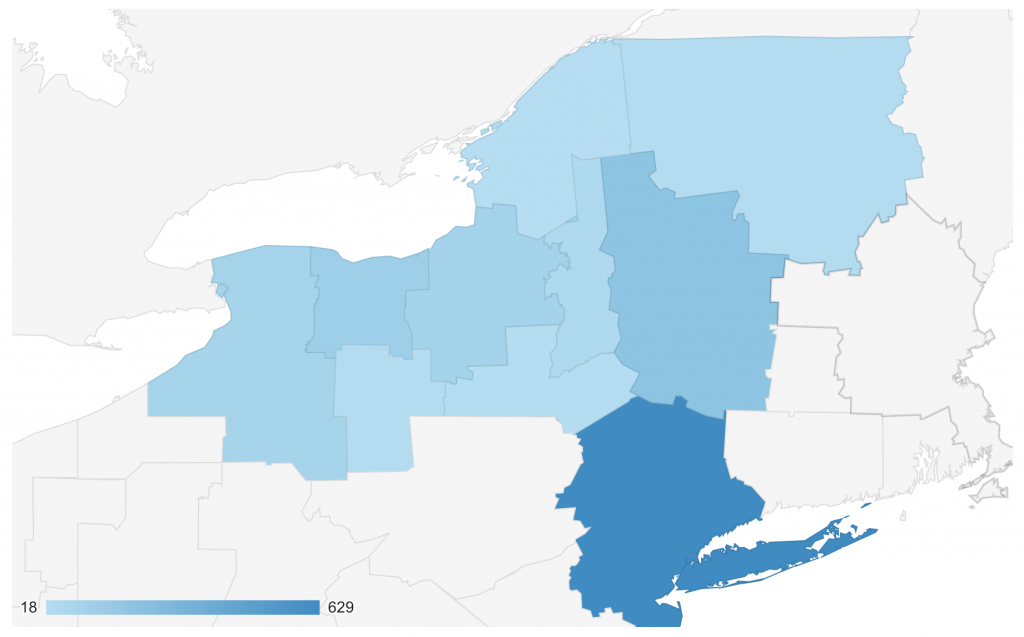
New York Regions
-
-
-
- NYC/LI – 629 (44%)
- Capital Region – 197 (14%)
- Unknown – 167 (12%)
- Rochester – 122 (8.5%)
- Syracuse – 94 (6.5%)
- Buffalo – 83 (6%)
- Utica – 46 (3%)
- Elmira – 27 (2%)
- Plattsburgh – 26 (2%)
- Binghamton – 20 (1%)
-
-
Desktop vs. Mobile:
-
- Desktop – 83%
- Mobile – 16.5%
- Tablet – 0.5%
Browsers:
-
- Chrome – 75%
- Safari – 15%
- MS Edge – 5.5%
- Firefox – 1.5%
- Internet Explorer – 1%
Traffic:
-
- Direct – 72.5%
- Search – 17.5%
- Referral – 8%
Landing Pages:
-
- Rethink 2021 – 1539 (15.5%)
- Home – 1,276 pageviews (13%)
- Culturally Responsive Education – 862 pageviews (9%)
- ELLS and/or MLS – 488 pageviews (5%)
- Rethink 2021 – 358 (3.5%)
- SEL – 289 pageviews (3%)
- Families as Partners – 222 pageviews (2.25%)
- You Are Here The Why – 205 (2%)
- Students with Disabilities – 196 pageviews (2%)
- Welcoming and Affirming Learning Environment – 185 pageviews (1.75%)